

Case Studies
Inventory Reduction Case Study
Inventory composition in high mix, low volume industries such as orthopedics should ideally be proportional to revenue, but it isn't for a variety of reasons including large economic order sizes in manufacturing, desire from surgical facilities for complete implant sets and challenges in forecasting. Relatively few SKUs generate a company's revenue.
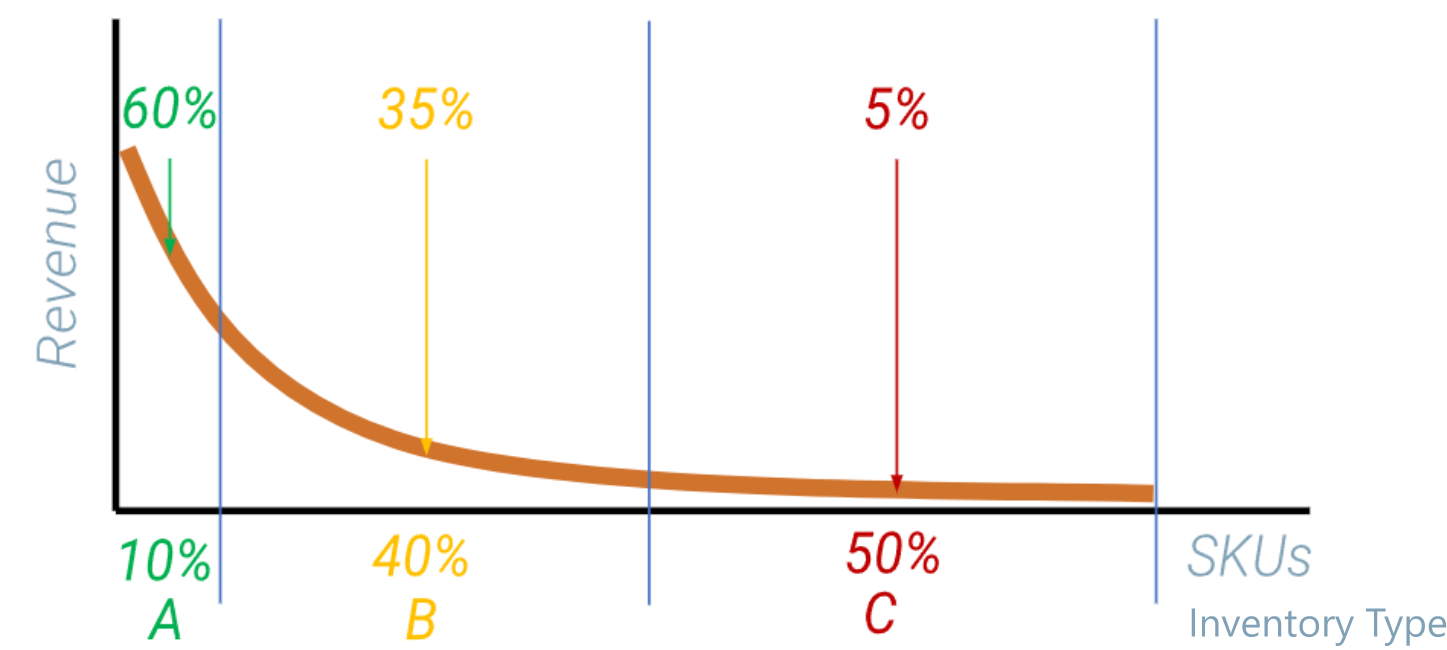
Inventory Proportions
The annual cost of inventory for an orthopedic OEM is >8% of sales based on factors such as Cost of Money, Excess & Obsolescence Expense as well as Shipping & Handling Expense associated with moving inventory from one location to another. There is a significant opportunity available with High Velocity Manufacturing to right-size inventory levels through shorter lead times and MOQs as low as one unit - essentially just in time manufacturing for orthopedics.

Our High Velocity Manufacturing approach has demonstrated implant inventory savings across a variety of implant systems. The inventory figures shown below are for a mid-sized OEM's cementless knee system and represent three different scenarios with the blue bars showing implant set field inventory and the orange bars showing warehouse/safety stock inventory in each case:
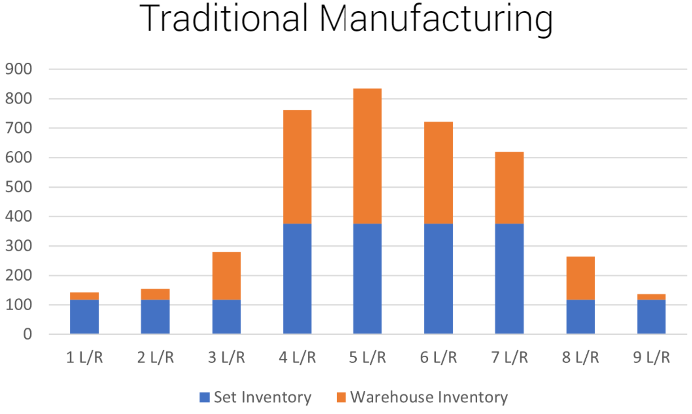
Traditional batch manufacturing method; 4-month lead times and MOQs of 15.
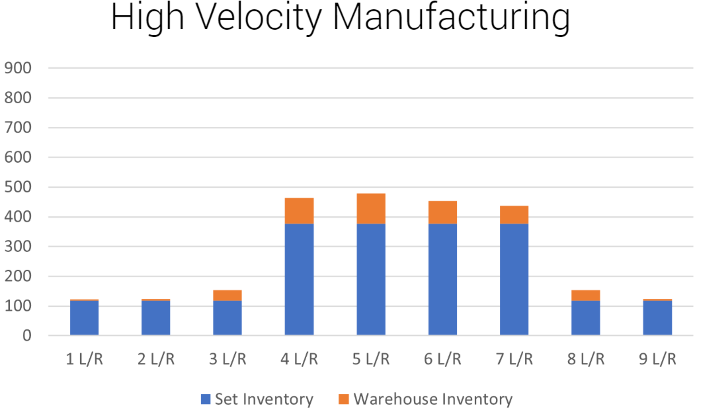
High Velocity Manufacturing approach; 4-week lead times and MOQs of 1. Warehouse inventory levels reduced by 77%.
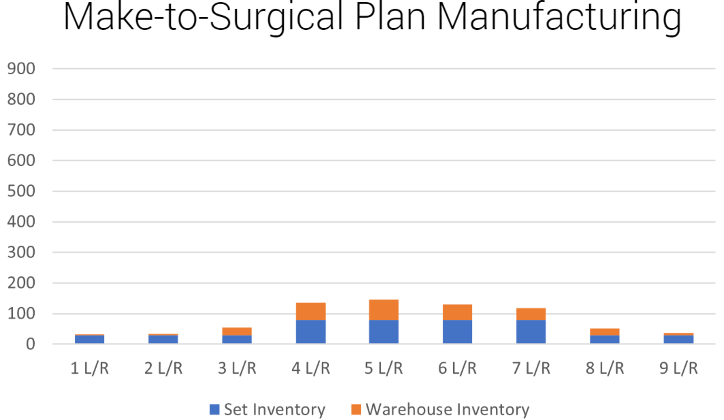
High Velocity Manufacturing approach; 3 week delivery of only the implants needed for a given surgery based on pre-operative planning. Avoids significant implant set inventory build, reducing overall inventory levels by 81%.
Contact Us to Learn More